 eatyourpeas
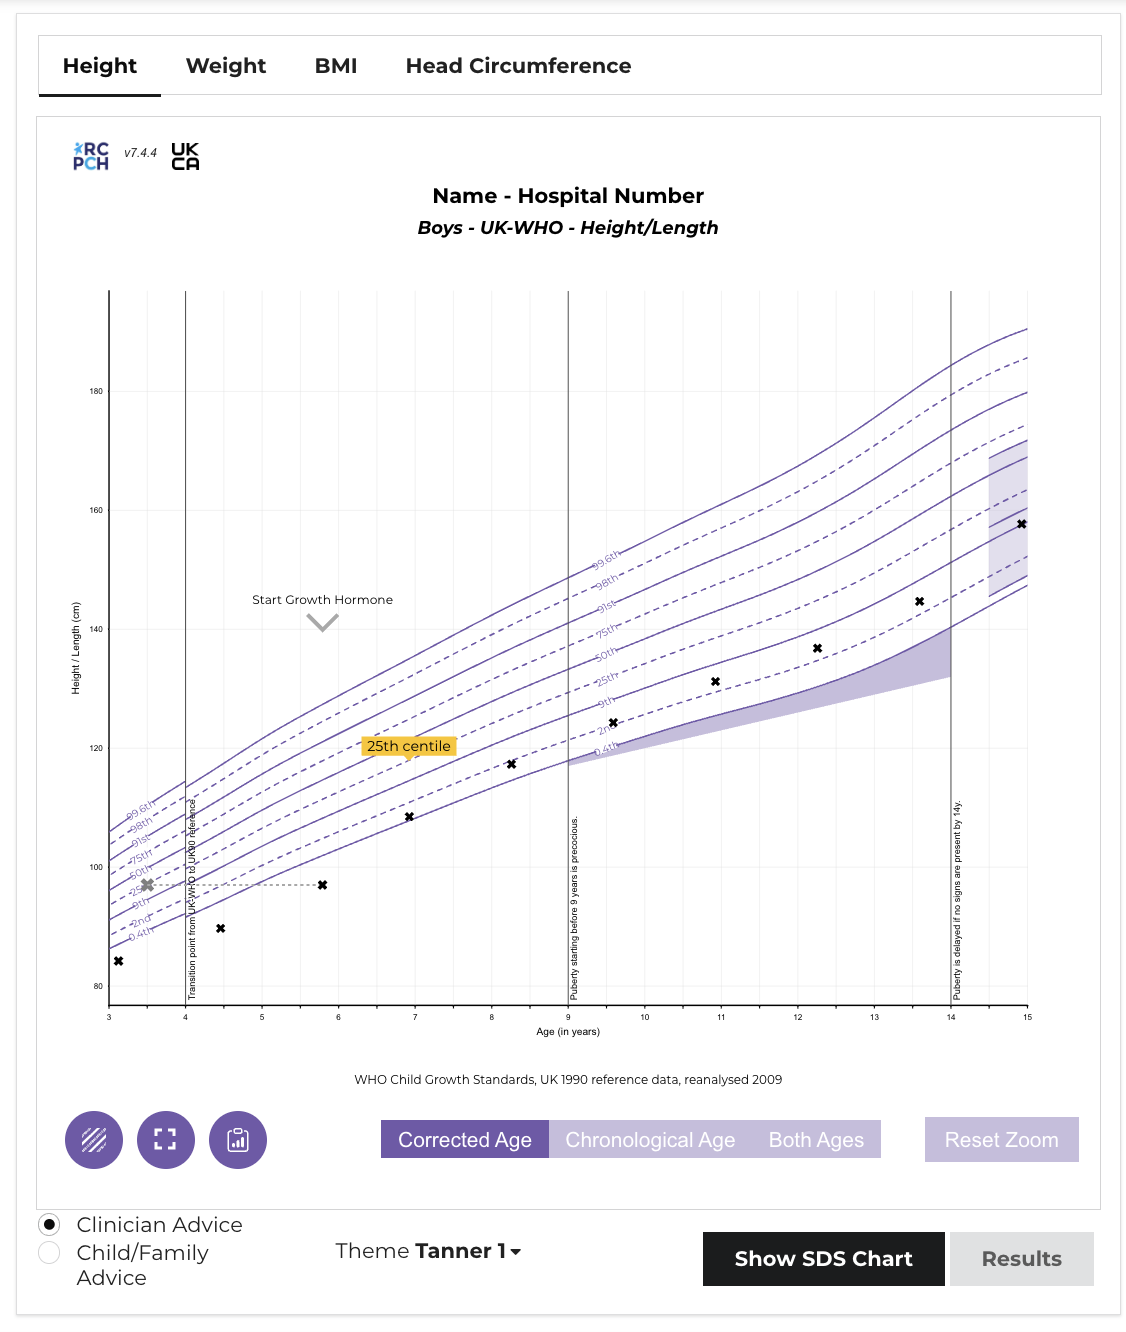
Over the years I have had several goes at growth charts. There are implementations in node.js, sqlserver and visual basic. In 2019/2020, the Royal College of Paediatrics were looking to digitize the charts that they had developed in the 1980s and published on paper.
Marcus Baw and I teamed up to build them.
Complexity
The are a handful of implementations of children’s growth charts, and all of these are based on a statistical technique to chart biological data known as the LMS method, developed by Professor Tim Cole. This compresses the reference data into 3 values for each age interval, and these can be used to calculate a centile and SDS for any measurement against an age, sex and gestation at birth.
Rather than bundle the complicated calculations into the charts and publish as a standalone application, RCPCH took the unique step of separating the calculation logic from the charting and publishing the caclulation as an API.
This is the first proper production level project I had been involved in, and as a small agile team, Marcus and I put the project together inside of 18 months, together with a full suite of tests, continuous integration, documentation and a demo site.
Python
Although neither of us had really used python that much before, we reasoned that it was the most accessible and familiar programming language and if we were to recruit research or clinical colleagues to contribute we should meet them where they were. We started as a flask project which contained both the calculation code, the endpoints and the templates but this became too crowded and in one heavy week Marcus broke it all into pieces, separating out the business logic from the API.
How they work
Although growth charts all tend to use the same approach - the subtleties are enough to make edge cases easy to find.
- Calculate age in decimal years (divide age in days by 365.25 to account for leap years ever 4 years)
- Use the decimal age to look up the nearest L, M and S values in the data tables
- Interpolate if ages fall between values
- Plug the L, M and S values into an equation
- Convert the resulting z score to a centile
- Graph the result
In fact, the graphing of the result could be independent of the calculation and this led to spin off projects which could all work together:
- RCPCHGrowth This is python package and is where the calculations and reference data are maintained. It sits on PyPi and can be pulled into any project.
- Digital Growth Charts Server This is a FastAPI project that consumes the package and handles all the requests and responses and validation
- Digital Growth Charts React Component Library This is a React library that houses the graph, ready to receive the server response
In the process we also built a client (to consume the library) and a mobile app.
Learning
This was a huge learning curve for me. I came to be more confident with python, understand APIs and of course got to learn about graphing children’s growth in detail. I was simultaneously working on 3 interconnected projects across different repositories which taught me all about git, version control and team working in software.
The pattern of working as part of a develpment board, overseen by a project board of growth experts formed a template for all RCPCH projects going forward.